
At Inviso, we sometimes get requests from customers who want an alternative to the conventional drill-down option in Tableau – the one using the plus and minus sign that appear when you hover over the column headers. There are a few ways to work around this, but none of these methods are particularly elegant. So.. In this post, I am going to show you a neat way to drill between two levels in a hierarchy by clicking a point in the worksheet. The GIF below illustrates the concept – we can toggle between the country and the state level by clicking the bars in the chart.

To some people this probably feels like a more natural way of interacting with data. The method covered today however only allows drilling down a single level.
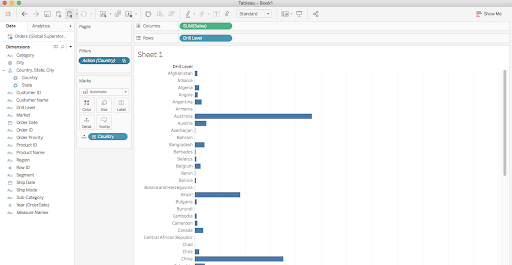
Using the Superstore data, the following steps will show you how to allow the user to drill from the country level to the state level by clicking the countries in the worksheet.
Step 1:
Go to your worksheet and find worksheet -> actions.
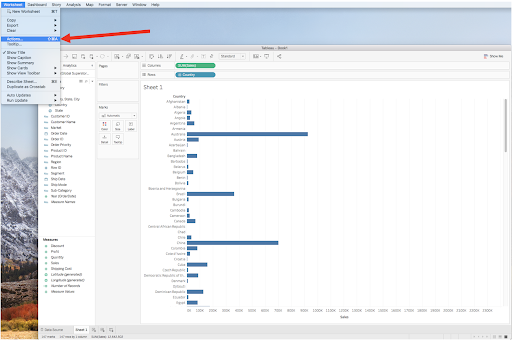
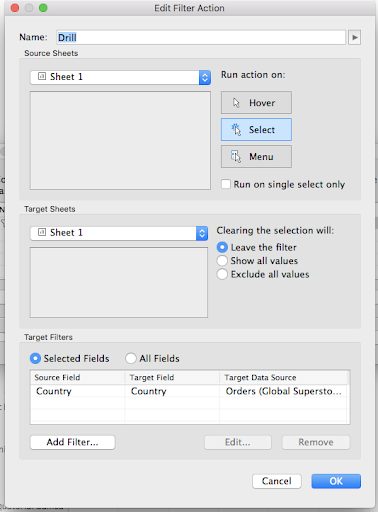
In the actions window, choose Add Action > and configure the action as follows:
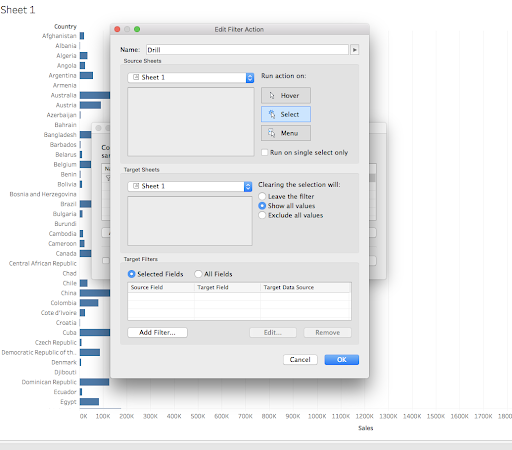
Click Add filter and choose Country in field.
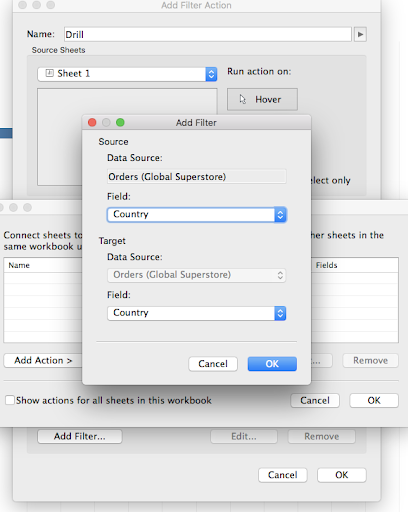
Now you should be able to filter all countries except the one you’ve clicked and by clicking again, the filter should be removed like so:

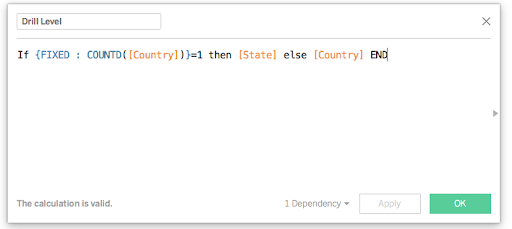
Step 2:
Create a calculation like the following:
Step 3:
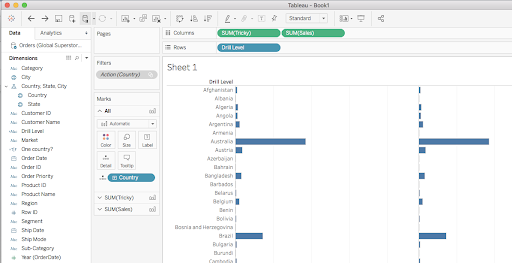
Pull the calculation (Drill Level) to Rows and add Country to Detail
Step 4:
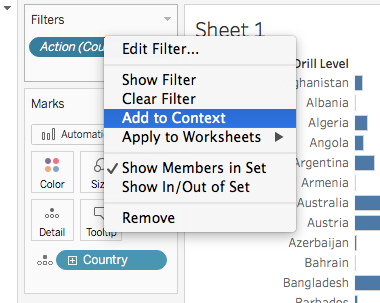
Right Click on action and press Add to Context:
Step 5:
Edit the action so it is configured to Leave the filter when nothing is selected.
Step 6:
Make a calculation that evaluates whether one country is selected. This will be used in step 7:

Step 7:
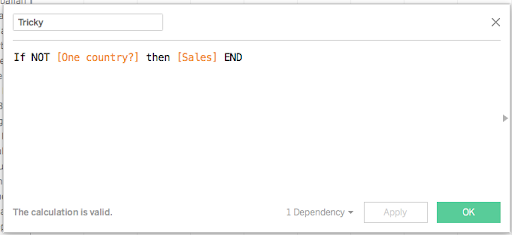
Make a calculation that returns the Sales if no specific country is selected:
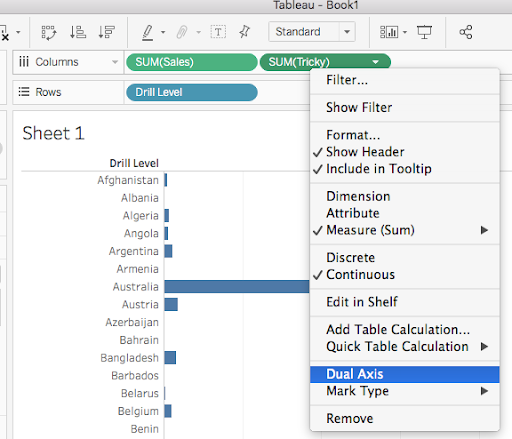
Step 8:
Leave the Tricky calculation on the Columns shelf and form a dual axis, that has the same aggregation as the one you are showing (in this case the SUM).
Step 9:
Remove the Country from the Marks card

Step 10
Form a dual x-axis:
Notice that the SUM(sales) should be to the right of the Tricky calculation in order for the drill to work optimally.
Step 11 (Final step):
Edit the Marks card by removing the Color pills and converting to bar charts:

If all the steps were performed correctly, you should be able to drill down by clicking the bars in the worksheet.
Credits:
Marc Reuter, Tableau. Source: https://www.youtube.com/watch?v=d22A4XVoUEs

