Sometimes you are requested to make a table in Tableau, even though you want to make a fancy visualization.
A big table can overwhelming and confusing, but given the right options, it can also be very useful and contain a lot of information in a limited space.
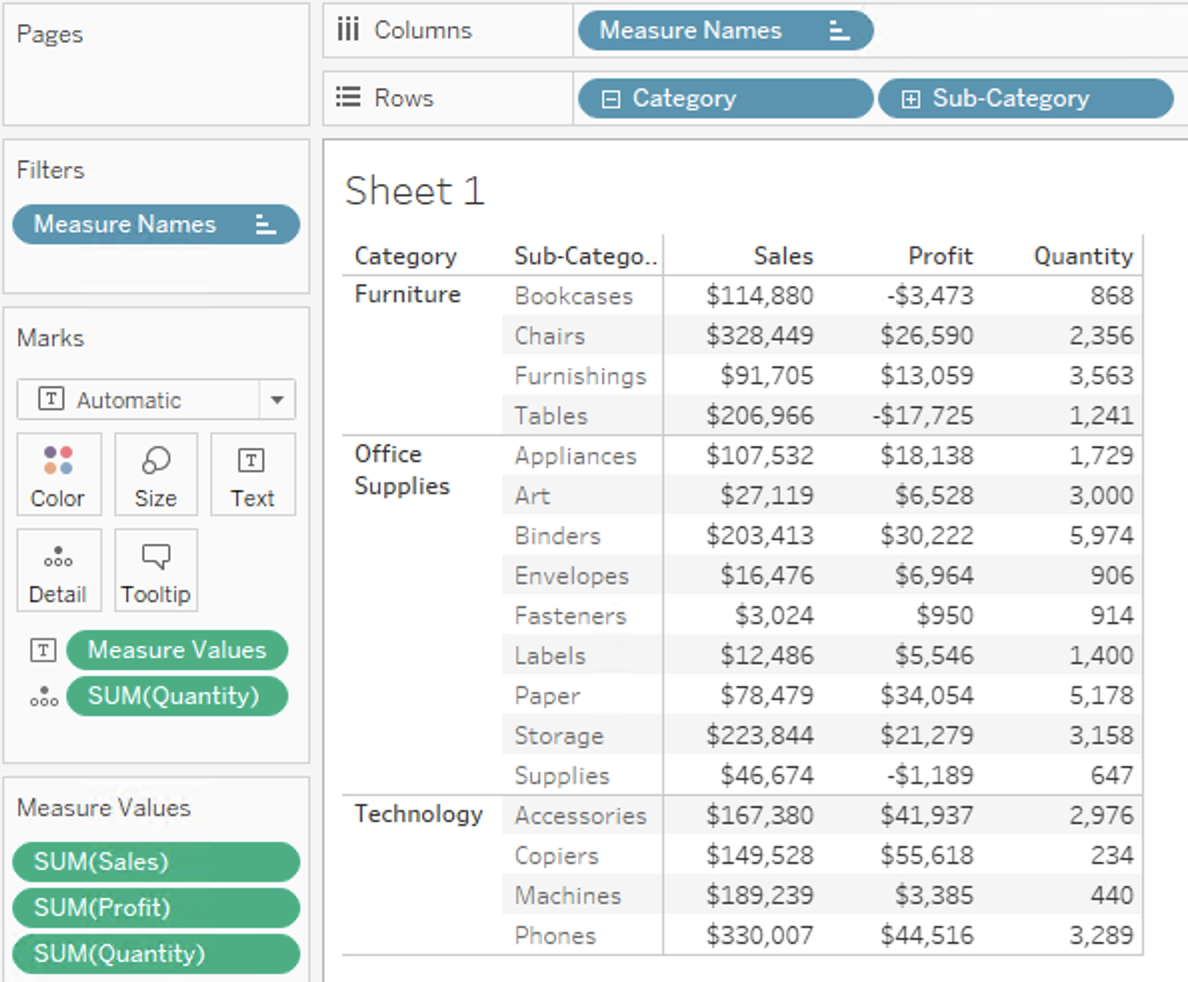
One trick that can help getting an overview of a big table is being able to sort the way you want to. If you have a table like this one, you might want to give the user the option to sort the data based on a measure, disregarding different dimensions in the view.
Two parameters are required to create custom sorting options. The parameters will work as sorting buttons.
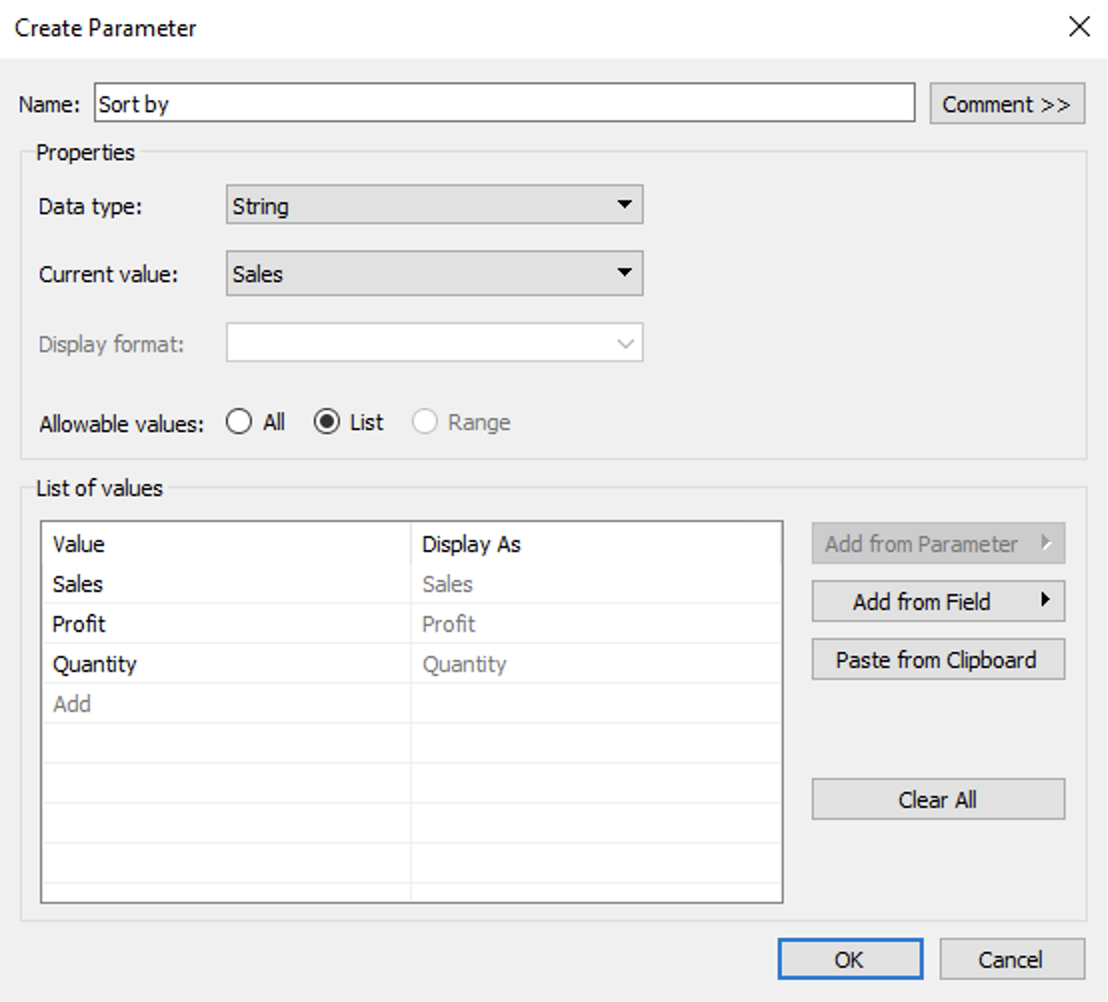
The first parameter should contain a list of all the measures the user should be able to sort by. In this example I want to be able to sort by Sales, Profit and Quantity.
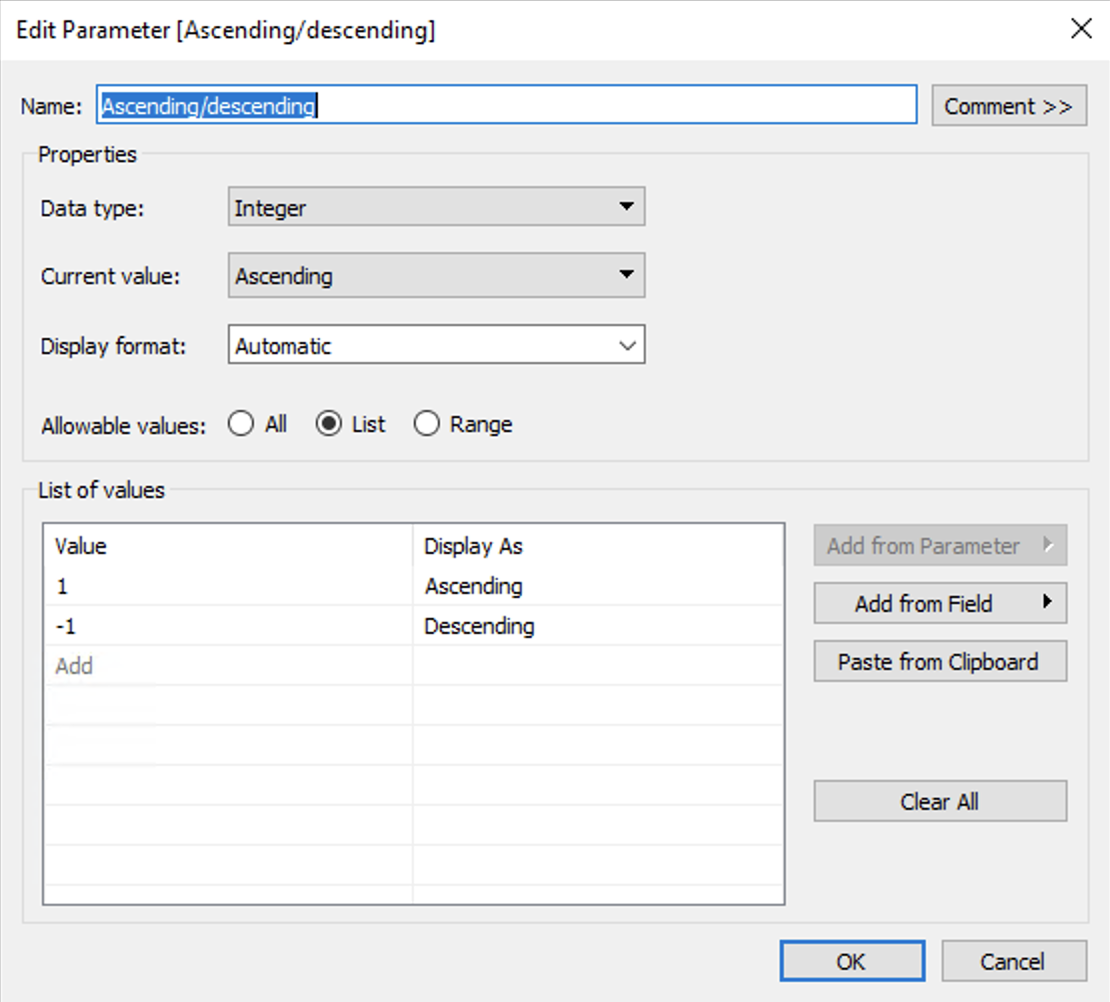
The second parameter is used to decide between sorting in ascending or descending order. It should contain 1 and -1.
As you know, we now need to use the parameters in a calculated field. The goal for the calculated field is to show the value of the selected field in the “Sort by” parameter times the value of the Ascending/descending parameter.
The field is called “Sort by field” and the logic uses “Case” and looks like this:
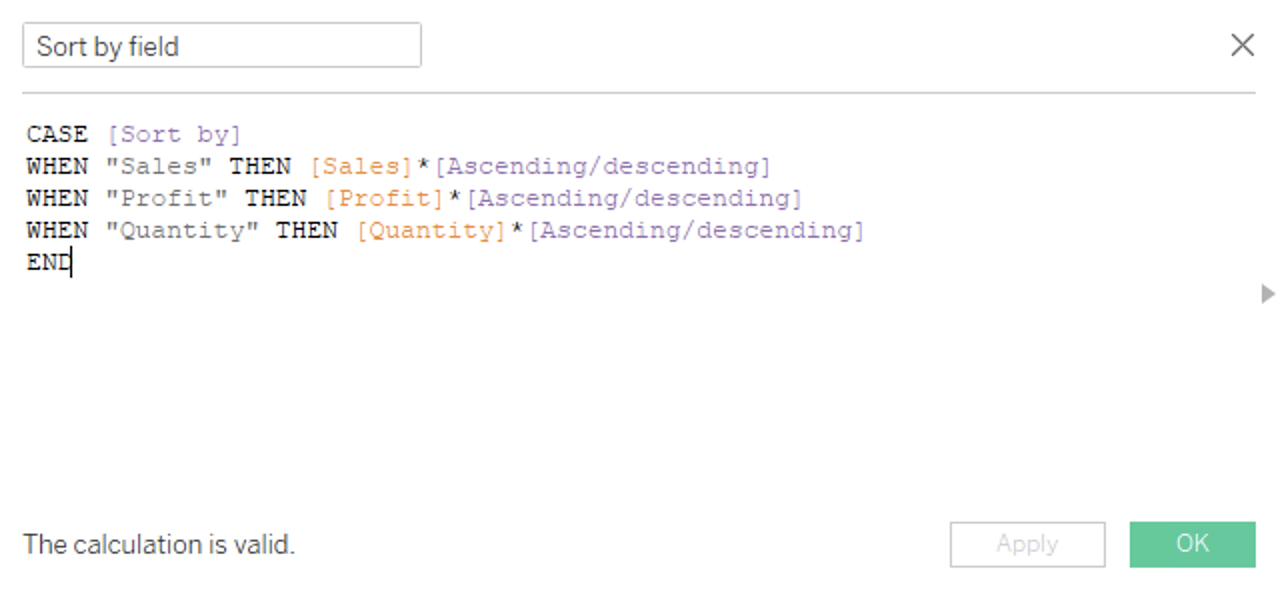
This can also be made using an IF-statement, but I believe “Case” is more simple, especially when adding more variables to the statement.
We now have a calculated field that changes value based on the two parameters created earlier.
To put this in use on the worksheet, drag the new “Sort by field” to Rows. This will at first make unwanted visualizations in the table. To avoid this, right click “Sort by field” on the Rows and change the field to “Discrete”. Now drag it leftmost on the Rows, and you can see your table change accordingly. Now right click it and deselect “Show Header”. Your table will now be sorted by this new, invisible measure.
Sort table by measures Video1 from Inviso on Vimeo.
To complete the job, right click the parameters and select “Show Parameter Control” to show the parameter controls.
When making your dashboards, remember to show the parameter controls and be sure to include a small description/help to let the user know what to do with the parameters.
Sort table by measures Video2 from Inviso on Vimeo.

